Why Data-driven Sales Strategies Work to Turn Prospects into Customers

Selling is no longer about giving lectures or presenting well-crafted powerpoint decks,  it’s about helping customers find a solution to their problem. The answer to helping your reps provide a solution based on a customer’s needs doesn’t lie in reams of notes either, it lies in data-driven sales strategies.

New technologies allow you to automate tasks and work smarter, but they also collect data. And data holds the key to your organization transforming its sales strategies. In fact, companies that actively use data have

50% higher growth rates

than those that don’t.

Boosting and retaining knowledge

One of the biggest issues with traditional sales training has to combat is that a

ccording to research

, the average person forgets 50% of the information presented to them. Within 24 hours that becomes 70%, and a week later it’s 90%. Did you know that proven way to improve knowledge retention is through reinforcement?

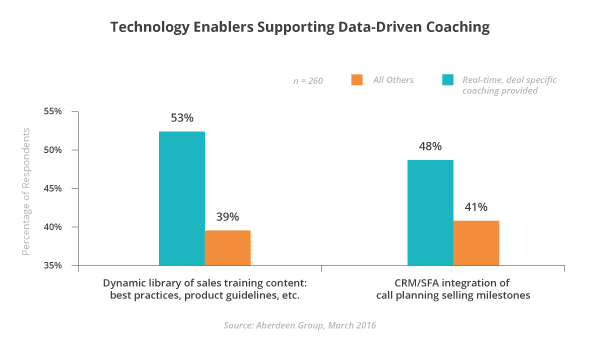
According to Aberdeen’s research, 26% of companies believe long-term sales learning reinforcement is actually more important than the training. This approach includes ongoing sales learning, which results in out-performance on a number of KPIs compared to those who don’t do this. Data-driven knowledge reinforcement boosts this even further.

Data-driven knowledge reinforcement can involve leveraging data to identify gaps in reps’ knowledge. Once the gaps are identified, knowledge can be reinforced through a variety of methods such as quick quizzes or providing content in real-time. Reps can’t refer to the notes tucked away in a folder in their office when they’re meeting a client. But technology can not only help them access information when they need it, but the data it collects can also help them find the right information and even identify what they need to know.

For example, reps can be served the right information they need for a customer meeting based on what has worked for other reps in a similar situation. Over the coming year, using data to serve more relevant content and leverage best practices of top performing reps will become an integral part of high-performing sales strategies.

Approximately

95% of B2B deals

are influenced by content, but it has to be the right content. Data doesn’t just help reps find the right content, it also gives valuable information to people who create the content to help them understand what is most valuable and the impact that it has on sales performance. This feedback helps them make better content that will continue to improve sales performance.

Improve coaching methodologies

Companies who use analytics-driven sales coaching methodologies can improve their time-to-productivity by 21% according to

research by Aberdeen Group

. This is enabled by technology that helps managers coach on-the-go.

The research also found that top performers are 62% more likely to have real-time coaching for specific deals, opportunities or accounts. By enabling your managers to coach their remote salespeople in real-time on tactical issues they can help them win more deals.

Real-time deal coaching is 35% more likely to be used with dynamic training content. As described above, the data collected by technology can now help you understand what reps need to be coached on and the information they need to be given access to. Together this has the power to improve their performance as they’re speaking to customers.

This can even create an environment where reps’ create a demand for knowledge and draw on it when they need it. The more relevant the learning, the more likely reps will continue to use it regularly. Future sales strategies will be driven by what reps need and demand.
Technology-Enablers-Supporting-Data-Driven-Coaching-Aberdeen-Graphs

Data can help sales leaders understand what they should be coaching on and when. If they can see that reps are losing deals after their demo, for example, then it may mean they need coaching to help convert those opportunities. This can also help speed up the sales cycle and improve productivity.

Increase success and quota attainment

Where the rubber really hits the road is when you connect the data from your sales readiness technology to your CRM. You can then connect each stage of the sales cycle, all your salespeople’s activity, their pipeline and their results. By bringing this data together, you have the power to identify where reps are winning and losing deals, and what helps them succeed.

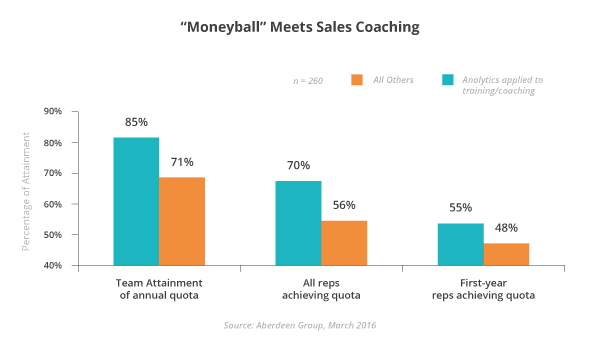
Research shows that applying analytics to training and coaching can improve quota attainment from 71% to 85%.

Moneyball-Meets-Sales-Coaching-Aberdeen-Graphs

This data can identify gaps, potentially suggest knowledge that would help plug those gaps and flow into an ongoing training program. The information can be used not only at an individual level, but can also help create high performing sales organizations by leveraging best practices from within your own team.

Analyzing data on key metrics at each stage of the process can identify what went wrong and what went right. By identifying best practices you can create repeatable performances that translate into predictable revenue. If you can identify what content and which message can help close deals quicker, this can create a step-change in the performance of all your reps, not just those that have ‘got’ it.

This data can also be used to predict success on a deal by deal basis, making revenue more predictable at an aggregate level. Productivity can improve as the data starts to give reps advice about when they should walk away from a deal and help them identify which deals to focus on.

Crucial to any data-driven strategy is your data – and the quality of your data depends on the tools that you use. From your CRM to sales readiness technology, it’s important to have a sales stack that enables your sales organization to be data-driven. Without it, your transformative sales strategies will fail. The technology must give you data that is accurate and relevant to what you’re trying to achieve.

Selling is complex enough in the modern age, your technology and data should make it simpler for your sales organization not more difficult. That’s why it’s important to find tools that capture, integrate and collate your data in a way that you can use it.

With the right tools and data at your disposal, you’ll have the power to create more powerful sales strategies. This year and long into the future, data will be the key to transforming how your sales organization learns, sells and performs.

How does Data Drive Content Adoption and Learner Engagement?

data-drive-Content-learner-adoptionDid you know that

up to 80%

of all content produced for sales teams is never used? By leveraging microlearning and knowledge retention techniques in your sales enablement programs you can drive content adoption and learner engagement and ensure your investment is not wasted.

What is microlearning?

Microlearning, or bite-sized learning, is where information is broken down into smaller chunks so that it’s easier for sales reps to consume and retain. The bite-sized content is also perfect for just-in-time training, which means it’s more likely to be consumed.

A programme of content, or

a “micro-curriculum,” can be drip-fed over days, weeks and months. Leveraging quizzes and knowledge checks, with techniques like repeated retrieval and spaced repetition, sales reps can retain more information long-term.

Who benefits from microlearning today and how?

Millennial salespeople make up a significant portion of the current sales population today. B

y

2025 it’s estimated that millennials will account for 75%

of the global population. That’s why it’s important to address the preferences of the millennial workforce when implementing sales enablement initiatives, and millennials have a preference for brief, bite-sized content.

But it’s not just millennial salespeople that benefit from microlearning. All sales reps can benefit from microlearning, particularly with busy schedules and distributed locations. But just because information is bite-sized doesn’t necessarily mean it’s engaging. You still need to ensure the content is engaging.

How do you develop engaging content?

There are two common challenges to overcome when creating engaging content:

How long should the content be?

This depends on several factors including:

  • The demographics of your audience (like age and education level)
  • The subject matter (is it about new product features, process changes or specific skill development)
  • How important the content being shared is (is it ‘good-to-know’ or a business imperative)
  • How frequently the content is updated (is this static or evergreen content, or dynamic information like competitive insights)
  • How frequently will learners be exposed to this information (is it once-off baseline or onboarding knowledge, or part of ongoing training)

How can you drive learner engagement?

While many consider this question after sales training is completed, this question really should be addressed as the program is being designed. This will ensure the design can incorporate any features that will drive engagement, like knowledge checks.

How does Mindtickle solve these challenges?

Mindtickle is a sales readiness platform that helps high-growth customers like AppDynamics, Nutanix, MuleSoft and Cloudera solve these issues. Our experience gives us access to data (1)

from of over 200,000 sales representatives that span a broad range of demographic parameters – including age, education level, industry and type of sales team set-up (inside, field, BDRs etc.).

To find answers to these questions we conducted a deep-dive analysis to identify trends and best practices for content adoption across industries.

As a part of this analysis, we looked at several factors including the length and type of the content, time spent reading content, and whether the content included assessments. We also conducted additional analysis to find points of relevant correlation and to identify actionable results.

Now, let’s look at our findings for each of the challenges.

Challenge 1: How long should the content be?

Across all industries, salespeople are more likely to complete a module if the document is less than 5 pages long, but this drops drastically when the document contains 15 or more pages.

Document length and completion rate

But the size of the document isn’t the only factor, it’s also important to consider how much information is on each page and how it’s presented. To ensure the information is easier to read:

  • Use bullet points where possible to reduce text
  • Summarize content in graphics where possible
  • Use a complementary palette of colours that’s easy to read
  • Don’t use images just to add aesthetic value
  • Limit yourself to one concept per page

Of course, it is sometimes necessary to have longer documents due to the complexity and nature of the content or to achieve the desired learning outcome, but the document can still be made easier to read with these suggestions.

Challenge 2: How can you drive learner engagement?

The concept of ‘Test to Teach’ has been

well-accepted as a preferred alternative

to traditional testing in the context of school education.  The same principles apply to adult learners.

In her article 

Facilitating Adult Learning: How to teach so people learn

, Dr Lela Vandenberg talks about ‘Application and Action’ as an important principle when designing a program for adult learning. She says, “adult learners are busy, practical, and learn by doing. They learn best when:

  • There is an immediate application for the learning
  • They participate actively in the learning process
  • They can practice new skills or test new knowledge before leaving a learning session.”

Our data on sales reps confirm this. We found that sales reps spend more time on modules that included a quiz than those that didn’t. In fact, the presence of a short quiz improves engagement by 34% on average.
time spent content length

Though the overall findings are consistent across industries, the impact on each industry is different.
time spent industry

Including a quiz in the sales training module increased the time spent on a course considerably, particularly in the Pharma, BFS, E-commerce and Electronics industries.

Whether or not you should include intermittent quiz or knowledge checks will depend on the objectives of your sales enablement initiatives. And in case you were wondering, there is a difference between a quiz and a knowledge check. According to

The Training Doctor

:

  • A quiz is used to test a learner’s ability to apply content. Their responses are scored based on predefined parameters, with results often recorded and compared to their peers.
  • A knowledge check is used to review the content a learner has received to ensure learning took place. Learners are usually able to review the content until they feel confident enough to apply this knowledge.

In summary, optimize the engagement and adoption of your sales enablement initiatives by:

  • Leveraging microlearning – keep content short and to the point, between one to five minutes
  • Keeping content brief – below 15 pages but preferably less than five pages if possible
  • Making it easier to read – use bullet points, short sentences and graphics
  • Using quizzes and knowledge checks

While this analysis provides insights into how content can be made more engaging, it is always important to consider your own specific circumstances. Conducting a similar analysis with your own data will highlight any unique factors that may improve engagement and content adoption amongst your own sales reps.

By leveraging powerful data analytics you can empower your managers to make informed decisions and design more effective sales enablement initiatives. Data analytics will also help you prepare your sales reps for more effective customer conversations and equip them to become true champions for your organization.

 Footnotes:

1

Data Source: Usage Data of 200k+ Sales Reps on Mindtickle from January – April 2017.

Measuring Channel Partner Performance and Enablement

measuring_channel_partner_perfomance“What gets measured gets done.”

We know how important it is to measure the readiness our sales reps and the impact enablement initiatives have had on their ability to perform at the moment of truth, but how does it differ when you’re managing channel partners? In my customer conversations recently I’ve been speaking to channel partner managers to find out how they ensure their partners are ready to sell and how they track their own partner enablement initiatives.

[Tweet “How do the best in the business ensure their channel partners are ready to sell?”]

When you consider partner enablement there are some important questions that need to be asked and answered. I found a very useful summary of the relevant questions here, and have replicated it below.

Channel Partner enablement

While there were some differences, depending on whether their business had an exclusive, targeted or global channel partner strategy, overall I identified three levels of how they measured their channel partners.

[Tweet “There are three levels to measuring the effectiveness of your channel partners”]

1. Partner onboarding completion rate

The first metric that each customer looked at closely was how many of their channel partner’s reps actually finished their onboarding program. This was considered by all to be a good indicator of engagement levels, but most looked at it in terms of the type of partners that they had.

MT_Channel_partner_level

For those channel partner reps who are at Level 3 or have even committed some reps to sell solely their product, they found that their completion rates were often higher. This is because they had the most skin in the game and a lot more to lose if they weren’t doing well. Getting their reps’ onboarding right was step one in this process. For those who didn’t have exclusive reps but had many reps who were at Level 2, they’ve shown commitment and want to move up the ladder. So if their engagement levels aren’t doing well then many found it effective to let their channel manager know so that they could try to rectify the situation. While those who had many channel partner reps who were only at Level 1, many saw any sales of their product as just opportunistic, so when they found that their reps had low engagement levels it was unlikely that this would improve.

2. Partner certification rate

Once the onboarding is completed it doesn’t necessarily mean that the reps were ready to sell. To check that they were on message and understood the sales process many also had a certification. This meant that their channel partner reps’ completed a certification program.

Completing the certification successfully gave the channel partner managers demonstrates that the channel partner reps were ready to get out there and sell. Some even used it as a tool to reward their channel partners, allocating more responsibility or marketing funds to help them sell their product. It also allowed them to identify areas where there may be knowledge gaps or where the onboarding program could be improved in the future, thereby contributing to future enablement initiatives.

3. Correlation of channel partner’s KPIs with performance

Each channel partner manager set certain KPIs for their channel partners. These were aligned to their business objectives, whether it be the level of penetration into a new market or a quota for the number of qualified leads generated.

In order to ensure these KPIs were being achieved, each customer found it helpful to measure them against their enablement initiatives.

For example, one business, that had a global channel partner strategy, would look closely at the number of certified channel partner reps in each target region or industry to determine if their overall channel partner strategy was working. If there was a low level of penetration amongst those channel partners then they would look at finding new partners in that region to expand their potential reach.

While this may work when your organization has hundreds or even thousands of channel partners, it’s not possible to just find another partner if you have an exclusive or even targeted channel partner strategy. For those businesses, they would still correlate their KPIs with performance, but would then look at ways to improve the performance of their existing channel partners first rather than seeking out new ways. This meant that data on knowledge gaps and where engagement levels waned became more important.

Continuously improve your process

Regardless of their channel partner strategy, each customer believed that looking internally was important. Each set-aside time regularly, quarterly or bi-annually, to continuously question, analyze and improve their process.

In this process, each channel partner manager looked at a range of data points including onboarding and certification. For example, one looked at how many of their channel partner’s reps were accessing their monthly updates. Others analyzed what content was being referred to the most. This helped them identify what content was most useful so that they could improve their enablement initiatives.

Ask for what they want

Another method that some of the channel partner managers found very useful was to simply ask their partner reps. For example a couple of times a year you could survey or poll your channel partner reps to obtain feedback and encourage them to share ideas on how the process could be improved. This communication not only proved quite helpful but also increased the level of engagement of channel partner reps had with their product, as they could see they were willing to listen.

[Tweet “Measure the performance of your channel partners by aligning them with your business objectives”]

Regardless of the type of channel partner strategy, you have in place, measuring the performance of your channel partners is about aligning them with your business objectives. 

4 Sales Enablement Performance Metrics You Must Measure (And How to Improve Them)

As the director or manager for sales enablement, you’ve probably been more focused on tracking participation metrics, like a number of training sessions completed, amount of content produced, and so on (a whopping 48% of enablement managers track only that). And it’s understandable. These metrics give you an idea about the engagement level of learners and the effectiveness of the content produced by your team. Fair enough!

While these participation metrics are important to you when measuring the success of your sales enablement strategy, the positive impact of your efforts on revenue may not be as readily apparent to senior management. And expecting them to calculate the impact on revenue themselves may be wishful at best.

You have to make them see the revenue impact of your enablement initiatives by spelling it out for them — clearly and logically. This will frame their perception of the value your function is contributing to the organization.

Measuring the impact of sales enablement on business metrics is not straightforward

With marketing, it’s easy – traffic and leads are your go-to metrics. With sales — it is revenue generated and the number of deals closed. But what is it for sales enablement? There’s no one metric that can tell you the business impact of your efforts.

There will most probably be external factors that are influencing the business metrics you need to track. You cannot claim that the improvement in quota attainment is solely because of the efforts of sales enablement, for example. It may have played a crucial role, yes, but maybe reworking the talent acquisition strategy helped the HR department find better candidates this time as well. Possible, right?

Measuring the exact numbers are thus not so straightforward for enablement managers. Many take the approach of showing estimated revenue impact of their efforts — and that’s okay!

Here’s how you should go about it.

Proving the worth of your sales enablement efforts – Metrics to track

Metric 1: New hire ramp-up time

Cutting down the “time to productivity” is one of the primary parameters that can help you prove the effectiveness of your onboarding efforts.

Did you know that the latest inside sales report by The Bridge Group revealed that five months (and growing) was the average ramp-up time for new hires in SaaS companies

That’s a major red flag, especially when the average tenure of a rep is reported to be only 2.5 years.

Now let’s assume you have 20 new reps each with a quota of $1M per year, and you manage to reduce their average ramp-up time by one month. This means your onboarding program contributed $1.6M ($83,333 x 20) additional revenue, every year.

Closely tied with actual business results, interpreting the revenue value of ramp-up time is pretty simple.  How companies measure this metric varies immensely though, and depends on every company’s unique business context.

Tom Levey, the Senior Director for Sales Enablement at AppDynamics, for example, tracks the time to close the first $50K deal as the main metric to report the effectiveness of his onboarding programs. Like Tom, many sales enablement leaders prefer to track reps’ time to the first sale as their criteria to measure ramp-up time.

How you can improve on this metric:

Create a progressive, milestone-based onboarding plan. Map out the objectives according to the ramp up time that is appropriate for your business. A typical onboarding plan may look something like this:

  • First 30 days: Ensure all new reps have a thorough knowledge of processes and basic product knowledge.
  • 30-60 days: Clear articulation of the value proposition, basic objection handling, and how to use best practices.
  • 90-days: First sale worth over $50k made without any hand-holding.

Set the timelines and objectives according to your unique business context. Once you have this structure clearly laid out, it will help your reps focus their energies to accomplish the objectives. This will also push you to create very focused training material.

At the end of every week, you can identify slow learners, who are unable to reach the expected performance benchmark and need more attention.

Provide the right blend of online and in-person training opportunities to get new hires up to speed quickly. Reserve the latter to clear doubts, practice different sales scenarios, and discuss advanced topics, like the competitive landscape.

Assign scenario-based role-plays to help your reps become customer-ready faster. While the online training may build the baseline knowledge of your new reps, role plays help them gain confidence to master common customer conversations with ease.

Metric 2: Win rate

While an aggregate improvement in win rate is a big plus in your enablement report, segmenting this data will help you find useful insights to determine the course of your enablement strategy.

Show win/loss rate against specific competitors in your report. Over a period of time, you can prove how you are influencing your win rate against specific competitors by channelling your efforts.

How you can improve on this metric:

  • Equip your sales team with battle-cards and competitive intelligence that help them frame strong rebuttals and competitive moats.
  • Identify the gaps that are impacting your B players’ ability to close deals. This is the low hanging fruit you can work on first. Your access to data might be limited, which means you may only see the aggregate win rate. But if you can segment the data by geography or cohorts and evaluate win/loss rates of different sales teams and their knowledge levels, you might be able to identify valuable insights (you can do this if you use Mindtickle). You can then create specific training programs for teams that are falling short. Adding some actionable industry insights to the report might also be a good idea. For example, if you notice that reps in a particular cohort group are selling well in a particular industry or territory, you can understand what is working for them and share any relevant knowledge with the other teams. The impact of these insights on the other teams can then be measured and the results shared.

Metric 3: Percentage of reps achieving their quotas

In sales, everything boils down to the metric of quota attainment. Recent research noted that only 61% of reps in SaaS businesses achieve their quota. That means there’s an opportunity for sales enablement managers to improve 39% of the laggards.

Achieving an improvement in quota attainment can help you make a solid case that demonstrates all your training is not just about ‘knowledge addition’ for reps. It is actually bridging relevant, carefully-identified information gaps, to help your reps close more deals.

So if 30% of your reps attained quota last quarter; and this quarter it rose to 45%, you can for example, attribute that to your competitive insights initiatives that helped reps handle objections effectively and win more deals. Multiply this by the number of reps you have, and you can show how this improvement escalated the revenue impact for the business.

How you can improve this metric:

  • Identify the difference between learning patterns of achievers and laggards. Let’s say you find that all reps who achieve their quota have completed their ‘Objection Handling course for competitor A.’ You can make it mandatory for all reps to complete this course and measure its impact.
  • Start off with reasons why your reps are not reaching their quota and then fix them. If, for example, you find out their product knowledge is not up to the mark, you can conduct quizzes around different aspects of product knowledge to identify gaps and create courses to bridge these gaps.
  • Implement a 4-week quiz plan by segregating questions in four knowledge buckets — value proposition, competitive intelligence, case studies, and product knowledge. Roll out 3-4 questions every week to collect data and identify the knowledge gap that might be impacting your reps’ ability to win deals.

Metric 4: Sales cycle

The B2B buyer journey has become more complicated. And thanks to the involvement of multiple decision-makers, the average length of a sales cycle has gone up by over 22% in the past five years.

It’s simple — shorter sales cycle = more deals to close = more revenue. The maths is right, the impact is clear.

But reducing the sales cycle isn’t that simple! And this is especially because unless you do something groundbreaking, you’ll only be able to see the impact of your efforts reflected in the sales cycle over a period of time. Reducing sales cycle is thus more of a long-term objective for enablement managers.

As reducing the sales cycle is something that takes time, it makes sense to show the sales cycle in your report only once or twice a year. You can also show the revenue impact on compressing the cycle. For example, if you reduce the sales cycle by 10 days (down from the average duration of 4 months) and your average deal size is $20k — your estimated revenue impact could be $50-$100K additional revenue for every sales rep every year.

How you can improve this metric:

Sales cycle and win rates are interrelated. A lot of things that you can do to improve win rates will reduce your sales cycle as well. Apart from the suggestions mentioned above, here are few other things you can do to reduce your sales cycle:

  • Work with sales operations to identify the biggest drop off stage in your sales funnel. Hubspot was a pioneer when it came to implementing a data-driven approach to coaching. Mark Roberge, their VP Sales, talks about it in this For entrepreneur article. As an example, Mark suggests that if they see drop-offs at ‘worked-lead to demo conversions’ of their sales funnel, they usually break it down to find out if reps are struggling to connect with the prospects, or whether they are able to get in touch but unable to get their time for the demo. Depending on their findings, the coaching strategy is defined for maximum impact.
  • Next time you’re trying to decide on a sales enablement campaign or initiative, ask yourself just one question — ‘Will this information help my reps close more deals?’ If the answer is ‘no,’ discard the idea and move onto the next one. This will keep you laser-focused on the end impact and help you improve your metrics over time.
  • With Mindtickle customers, we’ve seen time and again that it is not about the number of content modules you create per month. You need to share relevant and high-quality content to trigger engagement amongst your reps and give them a reason to keep coming back to learn more. Recognizing the challenges and problems faced by reps plays a huge role in the success of your enablement efforts here.

And although the metrics given above are super important, don’t forget to track engagement metrics. While it might not be of supreme value to your business heads, it will definitely provide you with great insights that give you direction for effective enablement.

What metrics do you track to prove the impact of your enablement efforts? Tell us more about it in the comments section.