5 Sales Performance Dashboard Examples CROs Must Have to Improve Sales Readiness


CROs today have no shortage of dashboards to access across tools and teams. Bloated tech stacks – more than a third of companies in our recent research indicate sales orgs are using 10+ tools – means that it’s not a matter of finding data, it’s about sorting through sales performance dashboards to understand what’s important and what to do about it.
Sales orgs are using
And CROs don’t have time for that.
It’s pretty straightforward: here’s what they want to know:
- Why deals are won or lost
- When pipeline is at risk
- Where managers are spending time in sales coaching efforts
- Which enablement efforts are (or aren’t) working and scalable
- How to get more sellers hitting quota
They need a whole view of sales performance that’s inclusive of data from sales, enablement, operations, and marketing activities and they don’t want to sort through 10 different dashboards to find that reporting.
Complete visibility is possible and in this blog post, we’ll lay out the sales performance dashboards that will help CROs create scalability and winning in their sales orgs.
In this blog post, we’ll talk about:
- What is a sales performance dashboard
- Why adoption is not a reliable metric for sales performance
- 5 key sales performance dashboards for CROs
What is a sales performance dashboard?
A sales performance dashboard is a single hub for all your most important sales metrics including sales KPIs, hiring and onboarding metrics, training and coaching metrics, outreach metrics, and pipeline metrics. Broken down, here’s what RevOps and sales enablement leaders focus on:
A good sales performance dashboard should go beyond the stuff you find in the CRM and really help you understand which deals are at risk and answer questions like where you have issues with buyer engagement, potential issues with seller efficiency, who needs help on what topics, and how to win more.
For example, you should have visibility into which content and programs truly drive an ROI for customers, voice of market insights from calls on competitors, pricing, and so on.
On top of those considerations, best-in-class sales performance dashboards should also include the following:
Why adoption is not a reliable metric for sales performance
To be blunt: CROs don’t care about adoption. They rely on their CRM to give them data about where deals and forecasts stand, but even those tools aren’t good indicators of whether or not the team will hit quota. Looking at adoption metrics gives a single view that doesn’t surface any valuable information about deal health.
For example, our research indicates this:
Average sales rep
Reps at winning orgs
Reps at winning orgs
It’s clear that adoption is important here — but that’s only part of the story. Without a way to track sales performance and connect them to the number of role-plays performed, you’ll never know exactly if those role-plays had any impact on the rep’s performance in the field and ultimately, any impact on closing deals.
Another example is a training module with assessments. Your entire team may have completed them, but if they don’t remember what they learned or apply it when interacting with prospects, that adoption metric doesn’t have any real impact on revenue productivity.
The takeaway is simple: No single sales metric tells a full story.
Adoption and engagement are important, yes — but to get real insight into sales performance, you need to track, analyze, and learn from a much wider variety of data. That’s why a complete sales performance dashboard that tracks metrics across all enablement activities – onboarding, ongoing training, conversation intelligence, sales content, and key competencies development – is the most effective way to see a full picture of sales performance and productivity.
What do CROs care about?
With the above in mind, it’s important to build reporting and dashboards that answer questions CROs are probably asking their teams weekly.
- How healthy is my pipeline?
- Which deals are at risk or progressing nicely?
- Are reps doing the right volume of activities?
- Are they prepared to hit quota?
- What do my top reps do differently?
- What do my top managers do differently?
- What do my buyers and customers need from us in regard to positioning, pricing, our product, services, and integrations?
- What content and enablement programs are truly driving an ROI and being used by my team?
5 key sales performance dashboards for CROs
CROs, CSOs, and sales leaders want to fully understand how their teams (and even individual sellers) are moving toward true revenue productivity. For example:
- Is a new team or rep ready to sell?
- What are the top skill gaps in the organization?
- What do most reps do right (or wrong) in sales conversations?
In order to derive such insights, they’ve got to have the right data at the ready — visually presented in a way that’s easy to consume and take action on.
Though the sales performance metrics tracked vary from organization to organization, these are five key data reports all CROs need to improve sales performance.
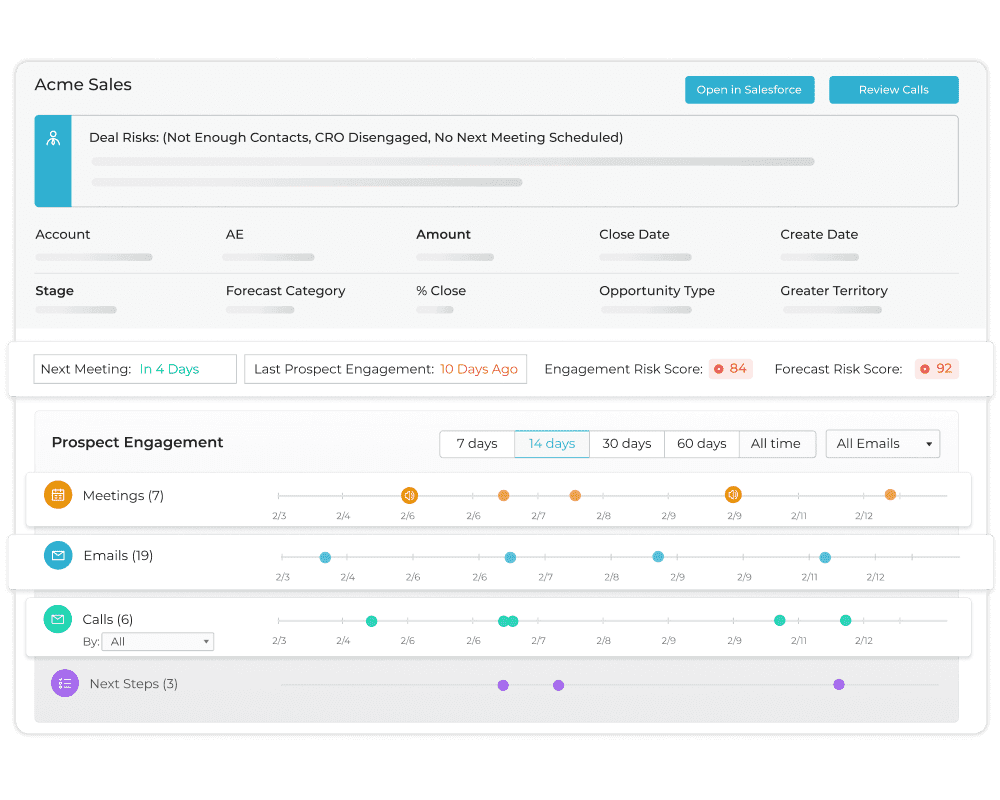
Pipeline + deal risk
A pipeline deal risk dashboard is a visual representation of the various risks associated with pipeline deals that allow CROs to assess the risks involved in each deal, prioritize deals based on their risk level, and take appropriate measures to mitigate them. Typically, these dashboards include the following:
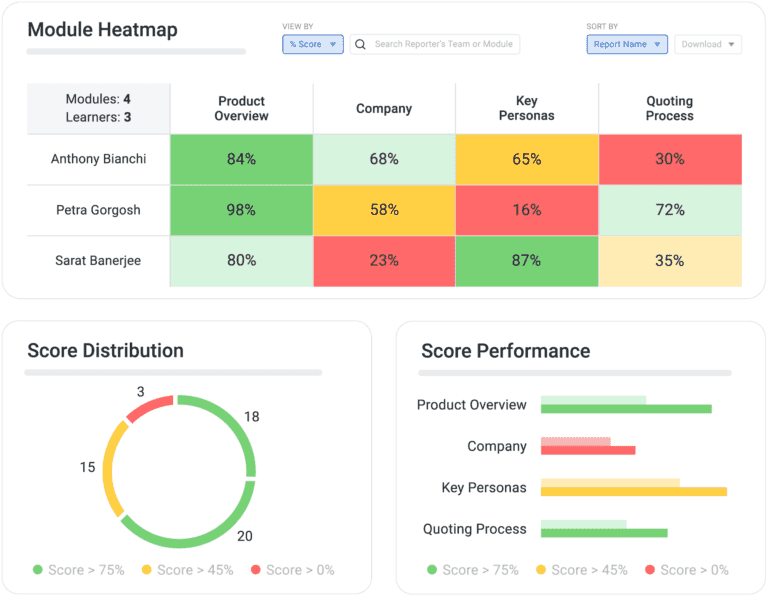
Sales Readiness Index
This dashboard helps organizations assess their sales team’s readiness to sell their products or services and provides an overall view of the sales team’s capabilities, identifying strengths and weaknesses that can be addressed to improve their sales performance. A Sales Readiness Index Dashboard typically includes the following components:
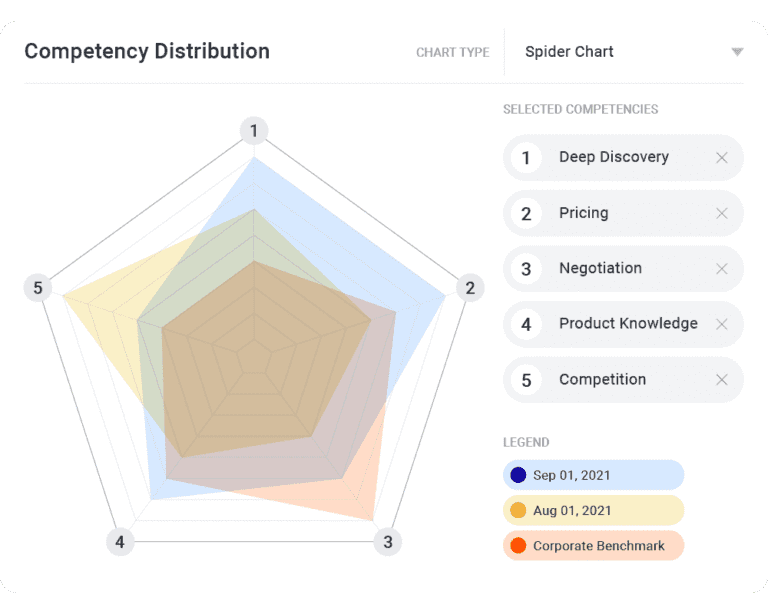
Ideal rep profiles
An ideal rep profile (IRP) is a profile of a sales rep who is likely to succeed at a given organization. Much like an ICP includes characteristics that make the customer “ideal,” an IRP defines the competencies and skills a rep must have to regularly close deals and meet (and surpass) quota.
The initial step in implementing a more effective readiness approach is to establish your ideal rep profile (IRP). This involves identifying the skills and competencies that are associated with successful sales outcomes, based on observations of your top performers.
Since each organization is unique, the IRP will differ from company to company. It is essential to create an IRP that reflects your organization’s sales goals and aligns with the specific needs of your customers.
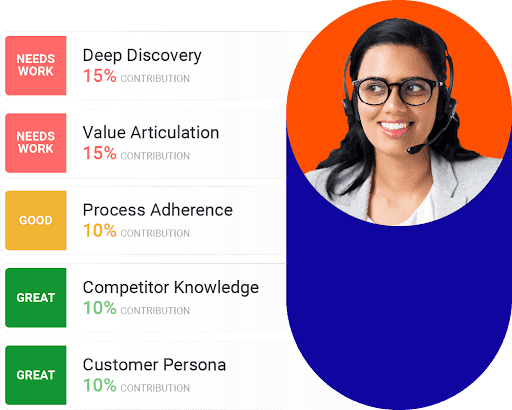
After setting up your IRP, it is crucial to evaluate your reps’ performance in comparison to these standards. This evaluation allows you to identify areas of strength and knowledge gaps that may hinder success. Understanding how each rep measures up to the benchmarks is essential in determining their skill level.
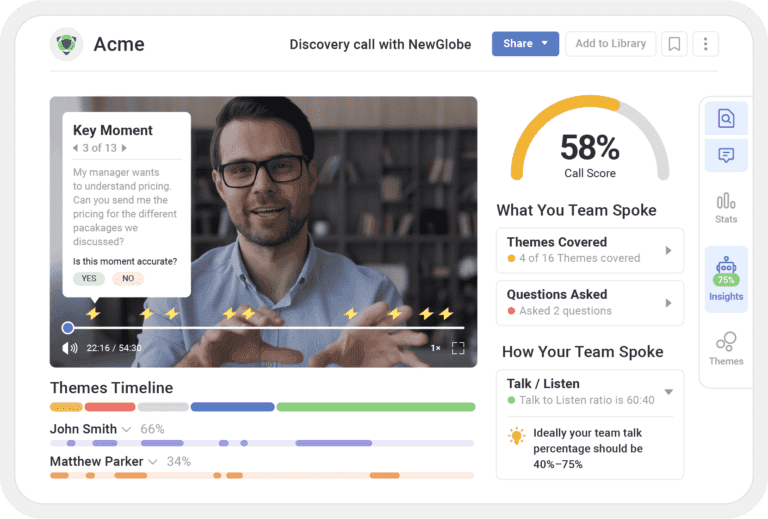
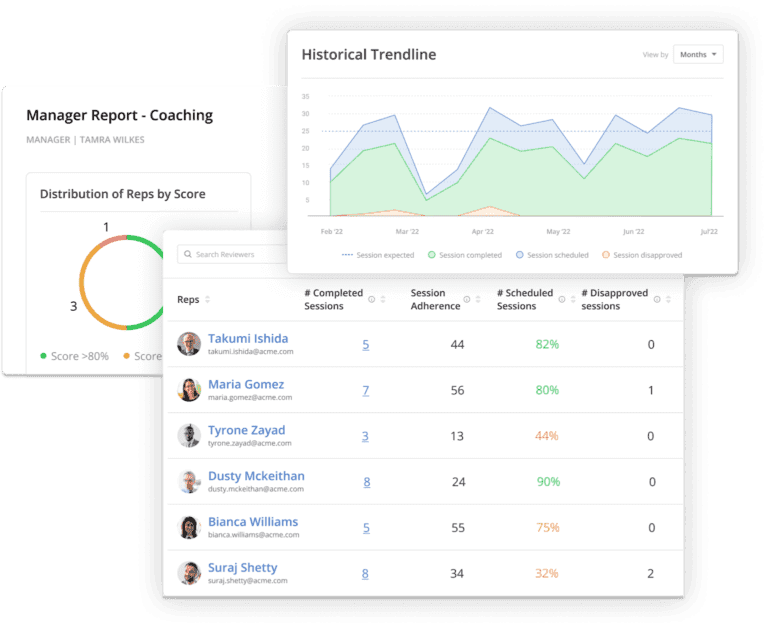
Sales coaching effectiveness
Overall, a sales coaching dashboard should provide sales coaches with the tools and information they need to improve the performance of their team and drive revenue growth. By tracking key metrics, providing targeted coaching, and enabling collaboration and communication, sales coaches can help their reps achieve their full potential and drive success for the organization.
A sales coaching dashboard should include the following metrics and features:
ROI of sales enablement efforts
This dashboard should calculate the ROI of sales enablement activities, based on the increase in revenue generated and the cost of sales enablement activities. This information can help sales leaders determine the value of sales enablement activities and make data-driven decisions about where to invest resources. It should include the following:
Access the insights you need to improve revenue productivity
Some sales metrics only tell part of the story. To fully track sales and revenue, you need a full sales performance metrics dashboard — one that helps CROs understand how training, enablement, and revenue productivity initiatives impact business results.
With Mindtickle, CROs have access to all of the performance dashboards they need to understand the impact of training and enablement on overall revenue productivity and take action to make data-based improvements. In fact, Mindtickle provides the right role-based reporting to every team member responsible for optimizing sales performance, from sales leaders to enablement to front-line managers.
Mindtickle in action
See how Mindtickle gives visibility into your sales team's performance so you can take action immediately and hit quota every quarter.
This post originally appeared in October 2021, was updated in May 2023, and again in January 2024.