How to Convert Your Training Presentations Into Awesome Videos

how to make great videos
You can create interactive videos to engage your learners at a whole new level. In the age of interactive and gamified learning, the one obstacle Learning & Development teams face is the ability to convert the existing text-heavy content into an interactive video. The charge to hire professionals to make great videos is quite high and one does not always have the budget for these video professionals.

What if you could quickly create your own videos, right from your desktop? Surprised? Well, don’t be! Even you can create interactive videos which are short, crisp, to the point, and engage your learners at a whole new level. And guess what? There are many basic tools which are easily available on the internet that allow you to make great videos!

Let’s step through the process of creating a learning video of your existing presentation, with the help of these tools.

The Planning Stage

It is absolutely vital that you plan your conversion process first. This would help you avoid unnecessary “outtakes” and prevent you from pulling your hair out.

To get started, make sure you:

  1. Break down the content into small presentations which cover all the topics. Make sure each topic is a bite-sized one so that you don’t overwhelm your learners.
  2. Remember to use animations to strengthen your presentation. These will be very useful to focus your learner’s attention, something that you might have relied on a trainer to do in a classroom setting.
  3. Identify how you can test each topic at the end of the videos and also give them further material to explore. This will ensure that your learners’ interest is kept high even after the lesson has ended
  4. Prepare a script for the voice over that you will record when running the slideshow. You need to have a plan about what to talk about on each slide. It is as good as giving a live presentation in a training session. Make sure the narrative is as interactive as possible. Keeping it casual and having a sense of humor in the script is the way to go.
  5. Keep the video script short and crisp. A learner’s attention span is usually around 3 to 4 minutes, which is why the ideal length of a learning video should not be more than that.

Here is a sample plan for the narrative for a screencast to search for a product on Google.

Make great videos

The Execution Stage

Once you have the topic presentation ready, then starts the fun part! Download a screen recording tool

use camtasia to make great videos

The tool that we recommend (and use internally) is Camtasia. It has extensive features but is also extremely user-friendly. Camtasia even adds a plug into your MS Office PowerPoint, from which you can record your presentations with a single click. In case you do not like Camtasia, there are lots of screen recorders that can be found on the internet which include:

Download any one of the above, which will enable you to record your screen when you are running a presentation.

Record the Video:

To start recording the video, you will have to use the screen recording tool. Prior to recording, make sure you have adjusted the settings according to your requirements. This will save you a lot of headaches if in case something goes wrong!

adjust camtasia recorder to make great videos

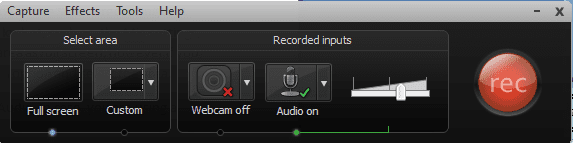
Once you are ready with the settings, click the Record button and start the presentation.

Voice During Recording

A very common beginner’s’ mistake during recording videos is that we forget to pay attention to our own energy levels. During a classroom training, the trainers also feed off the energy of the learners, and hence it creates an energetic, interactive experience. But while recording a video, the trainer does not have the energy of the classroom to feed off of. Due to this, even his energy levels drop while recording. This is the surest way to create extremely boring videos.

There are many ways to avoid having low energy during the recording session. Some people have found coffee or energy drinks to be useful, whereas others might resort to standing during the sessions or even jumping up and down in between the recording to maintain their high energy levels.

Important tip: Voice modulation can be the most versatile tool you have while recording a video, to bring emphasis to certain points. Try to use this to your advantage! Even minor fluctuations can be very effective.

Put on the Editor’s Hat:

Now that you have finished recording the video, it’s time to wear the editor’s hat! No movie is recorded in a single shot. You do not want the video to be incomplete or miss its crispness. Let’s add some make-up before it goes live!

  • In Camtasia, once you are done with the recording, the first step is to set the video output resolution. For web purposes, the best practice is to use the dimensions of 1280 x 720 pixels. If you do not select this and choose a setting which is lesser, the video that will be generated will not be ideal for full-screen playback on today’s screens. This means that your text and images might be too small for the learner to read and comprehend.
  • A simple timeline with the recording tool allows you to edit the video. In case you are not happy with the current recording, you can go back and record only those parts and merge it to the current timeline.
  • In the editor, you can very easily trim the video, cut it, increase the voice pitch for certain sections, and even zoom into the video while explaining the important parts. These (and a host of other more powerful features) really put the finishing touches on your video.

The Publishing Stage

Now comes the time to cut, save, and call it a day!

Once you have edited the video, the last step is to save the file in the format most preferred by you. If you any text in your presentations, then the ideal output for the video is the HD option which gives you a high-quality output. However, this does create quite large video files. Hence, if you wish to lower your bandwidth costs, then you could go in for a lesser resolution format. But do make sure that the text in the video is readable for your learners!

Run the video past your teammates or users and collect feedback. Use the feedback when creating the next video!

Congratulations! You just recorded a video with no help from professional video makers. The number of people using this method to record videos is increasing by the day. Though we just focused on making videos through screen recordings, the other popular forms are getting a cam recorder and record the demonstration of you presenting on stage or on a blackboard. Once recorded, you can edit the video with the help of your favorite recording tool.

We certainly hope that you will be creating a lot more videos from your presentations now, and join the brigade of L&D professionals who are using video regularly in their courses.

How do you record your videos? Do you have any tips or tricks that you can share with our community? Do share with us in the comments below!


4 Sales Enablement Performance Metrics You Must Measure (And How to Improve Them)

As the director or manager for sales enablement, you’ve probably been more focused on tracking participation metrics, like a number of training sessions completed, amount of content produced, and so on (a whopping 48% of enablement managers track only that). And it’s understandable. These metrics give you an idea about the engagement level of learners and the effectiveness of the content produced by your team. Fair enough!

While these participation metrics are important to you when measuring the success of your sales enablement strategy, the positive impact of your efforts on revenue may not be as readily apparent to senior management. And expecting them to calculate the impact on revenue themselves may be wishful at best.

You have to make them see the revenue impact of your enablement initiatives by spelling it out for them — clearly and logically. This will frame their perception of the value your function is contributing to the organization.

Measuring the impact of sales enablement on business metrics is not straightforward

With marketing, it’s easy – traffic and leads are your go-to metrics. With sales — it is revenue generated and the number of deals closed. But what is it for sales enablement? There’s no one metric that can tell you the business impact of your efforts.

There will most probably be external factors that are influencing the business metrics you need to track. You cannot claim that the improvement in quota attainment is solely because of the efforts of sales enablement, for example. It may have played a crucial role, yes, but maybe reworking the talent acquisition strategy helped the HR department find better candidates this time as well. Possible, right?

Measuring the exact numbers are thus not so straightforward for enablement managers. Many take the approach of showing estimated revenue impact of their efforts — and that’s okay!

Here’s how you should go about it.

Proving the worth of your sales enablement efforts – Metrics to track

Metric 1: New hire ramp-up time

Cutting down the “time to productivity” is one of the primary parameters that can help you prove the effectiveness of your onboarding efforts.

Did you know that the latest inside sales report by The Bridge Group revealed that five months (and growing) was the average ramp-up time for new hires in SaaS companies

That’s a major red flag, especially when the average tenure of a rep is reported to be only 2.5 years.

Now let’s assume you have 20 new reps each with a quota of $1M per year, and you manage to reduce their average ramp-up time by one month. This means your onboarding program contributed $1.6M ($83,333 x 20) additional revenue, every year.

Closely tied with actual business results, interpreting the revenue value of ramp-up time is pretty simple.  How companies measure this metric varies immensely though, and depends on every company’s unique business context.

Tom Levey, the Senior Director for Sales Enablement at AppDynamics, for example, tracks the time to close the first $50K deal as the main metric to report the effectiveness of his onboarding programs. Like Tom, many sales enablement leaders prefer to track reps’ time to the first sale as their criteria to measure ramp-up time.

How you can improve on this metric:

Create a progressive, milestone-based onboarding plan. Map out the objectives according to the ramp up time that is appropriate for your business. A typical onboarding plan may look something like this:

  • First 30 days: Ensure all new reps have a thorough knowledge of processes and basic product knowledge.
  • 30-60 days: Clear articulation of the value proposition, basic objection handling, and how to use best practices.
  • 90-days: First sale worth over $50k made without any hand-holding.

Set the timelines and objectives according to your unique business context. Once you have this structure clearly laid out, it will help your reps focus their energies to accomplish the objectives. This will also push you to create very focused training material.

At the end of every week, you can identify slow learners, who are unable to reach the expected performance benchmark and need more attention.

Provide the right blend of online and in-person training opportunities to get new hires up to speed quickly. Reserve the latter to clear doubts, practice different sales scenarios, and discuss advanced topics, like the competitive landscape.

Assign scenario-based role-plays to help your reps become customer-ready faster. While the online training may build the baseline knowledge of your new reps, role plays help them gain confidence to master common customer conversations with ease.

Metric 2: Win rate

While an aggregate improvement in win rate is a big plus in your enablement report, segmenting this data will help you find useful insights to determine the course of your enablement strategy.

Show win/loss rate against specific competitors in your report. Over a period of time, you can prove how you are influencing your win rate against specific competitors by channelling your efforts.

How you can improve on this metric:

  • Equip your sales team with battle-cards and competitive intelligence that help them frame strong rebuttals and competitive moats.
  • Identify the gaps that are impacting your B players’ ability to close deals. This is the low hanging fruit you can work on first. Your access to data might be limited, which means you may only see the aggregate win rate. But if you can segment the data by geography or cohorts and evaluate win/loss rates of different sales teams and their knowledge levels, you might be able to identify valuable insights (you can do this if you use Mindtickle). You can then create specific training programs for teams that are falling short. Adding some actionable industry insights to the report might also be a good idea. For example, if you notice that reps in a particular cohort group are selling well in a particular industry or territory, you can understand what is working for them and share any relevant knowledge with the other teams. The impact of these insights on the other teams can then be measured and the results shared.

Metric 3: Percentage of reps achieving their quotas

In sales, everything boils down to the metric of quota attainment. Recent research noted that only 61% of reps in SaaS businesses achieve their quota. That means there’s an opportunity for sales enablement managers to improve 39% of the laggards.

Achieving an improvement in quota attainment can help you make a solid case that demonstrates all your training is not just about ‘knowledge addition’ for reps. It is actually bridging relevant, carefully-identified information gaps, to help your reps close more deals.

So if 30% of your reps attained quota last quarter; and this quarter it rose to 45%, you can for example, attribute that to your competitive insights initiatives that helped reps handle objections effectively and win more deals. Multiply this by the number of reps you have, and you can show how this improvement escalated the revenue impact for the business.

How you can improve this metric:

  • Identify the difference between learning patterns of achievers and laggards. Let’s say you find that all reps who achieve their quota have completed their ‘Objection Handling course for competitor A.’ You can make it mandatory for all reps to complete this course and measure its impact.
  • Start off with reasons why your reps are not reaching their quota and then fix them. If, for example, you find out their product knowledge is not up to the mark, you can conduct quizzes around different aspects of product knowledge to identify gaps and create courses to bridge these gaps.
  • Implement a 4-week quiz plan by segregating questions in four knowledge buckets — value proposition, competitive intelligence, case studies, and product knowledge. Roll out 3-4 questions every week to collect data and identify the knowledge gap that might be impacting your reps’ ability to win deals.

Metric 4: Sales cycle

The B2B buyer journey has become more complicated. And thanks to the involvement of multiple decision-makers, the average length of a sales cycle has gone up by over 22% in the past five years.

It’s simple — shorter sales cycle = more deals to close = more revenue. The maths is right, the impact is clear.

But reducing the sales cycle isn’t that simple! And this is especially because unless you do something groundbreaking, you’ll only be able to see the impact of your efforts reflected in the sales cycle over a period of time. Reducing sales cycle is thus more of a long-term objective for enablement managers.

As reducing the sales cycle is something that takes time, it makes sense to show the sales cycle in your report only once or twice a year. You can also show the revenue impact on compressing the cycle. For example, if you reduce the sales cycle by 10 days (down from the average duration of 4 months) and your average deal size is $20k — your estimated revenue impact could be $50-$100K additional revenue for every sales rep every year.

How you can improve this metric:

Sales cycle and win rates are interrelated. A lot of things that you can do to improve win rates will reduce your sales cycle as well. Apart from the suggestions mentioned above, here are few other things you can do to reduce your sales cycle:

  • Work with sales operations to identify the biggest drop off stage in your sales funnel. Hubspot was a pioneer when it came to implementing a data-driven approach to coaching. Mark Roberge, their VP Sales, talks about it in this For entrepreneur article. As an example, Mark suggests that if they see drop-offs at ‘worked-lead to demo conversions’ of their sales funnel, they usually break it down to find out if reps are struggling to connect with the prospects, or whether they are able to get in touch but unable to get their time for the demo. Depending on their findings, the coaching strategy is defined for maximum impact.
  • Next time you’re trying to decide on a sales enablement campaign or initiative, ask yourself just one question — ‘Will this information help my reps close more deals?’ If the answer is ‘no,’ discard the idea and move onto the next one. This will keep you laser-focused on the end impact and help you improve your metrics over time.
  • With Mindtickle customers, we’ve seen time and again that it is not about the number of content modules you create per month. You need to share relevant and high-quality content to trigger engagement amongst your reps and give them a reason to keep coming back to learn more. Recognizing the challenges and problems faced by reps plays a huge role in the success of your enablement efforts here.

And although the metrics given above are super important, don’t forget to track engagement metrics. While it might not be of supreme value to your business heads, it will definitely provide you with great insights that give you direction for effective enablement.

What metrics do you track to prove the impact of your enablement efforts? Tell us more about it in the comments section.